Fusedash vs SERPView
Side-by-side comparison to help you choose the right AI tool.
Fusedash transforms raw data into instant AI-powered dashboards for real-time team insights.
Last updated: March 4, 2026
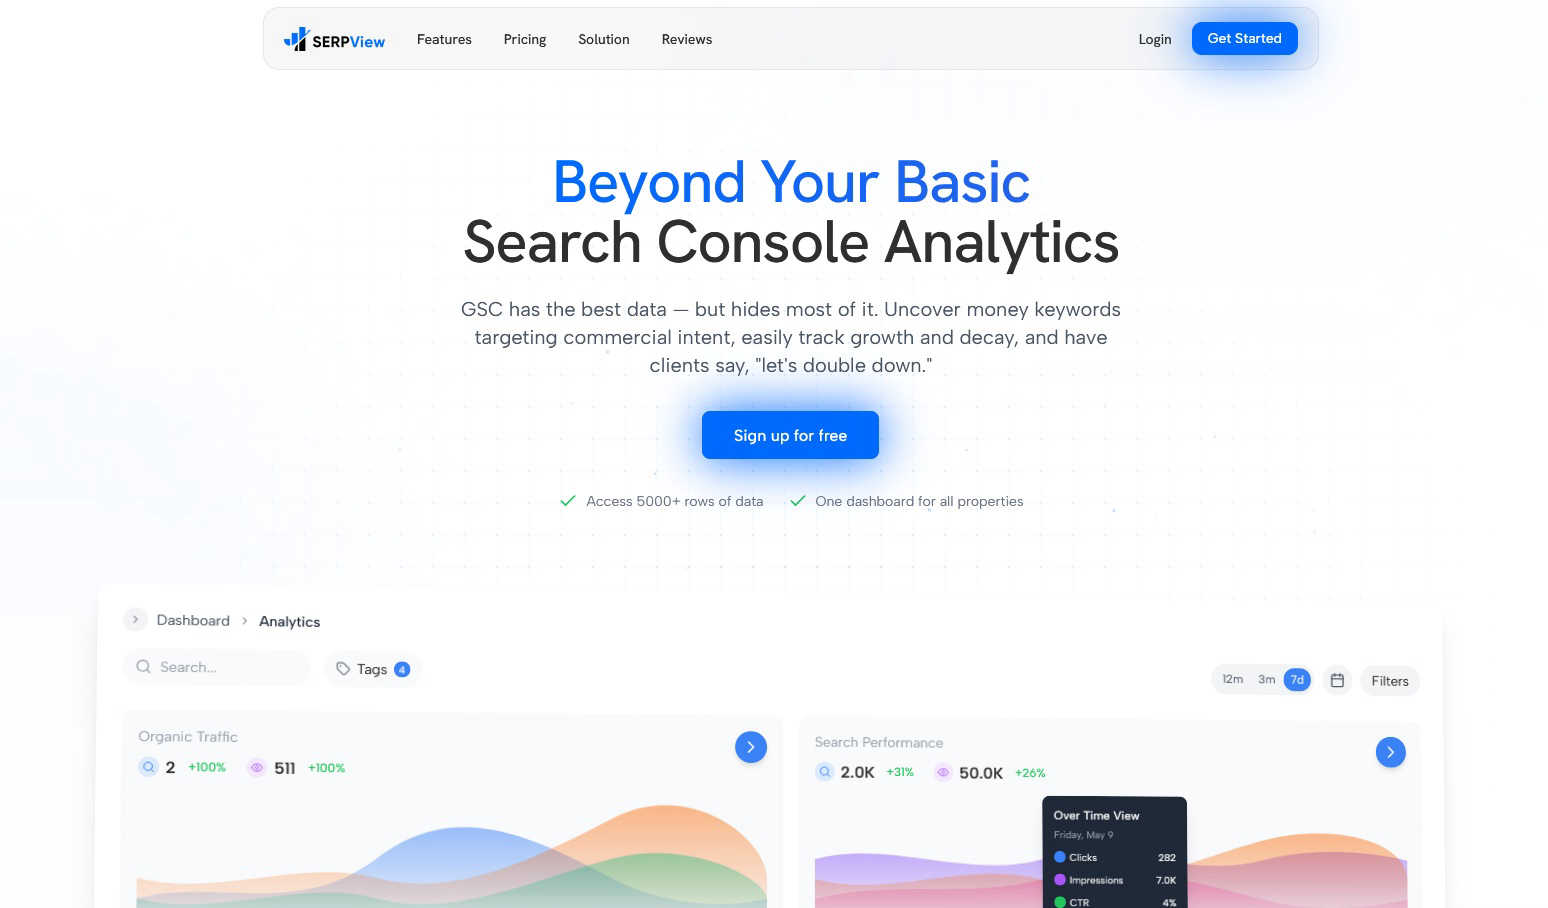
SERPView
SERPView unlocks hidden Google Search Console data for advanced SEO insights and limitless analytics.
Last updated: February 28, 2026
Visual Comparison
Fusedash

SERPView
Feature Comparison
Fusedash
Unified Intelligent Workspace
Fusedash consolidates the entire data visualization stack into a single, coherent environment. Gone are the days of juggling separate tools for dashboards, charts, maps, and reports. This singular workspace allows teams to build interactive dashboards for real-time monitoring, craft detailed narrative reports with storytelling sections, and generate standalone AI-powered charts—all from the same connected dataset. This architectural unity eliminates redundant work, ensures metric consistency, and provides a holistic view of performance, enabling a seamless flow from monitoring to deep analysis to communication.
AI-Powered Chart & Insight Generation
Harness the power of integrated artificial intelligence to accelerate data exploration. The platform's AI chart generator transforms raw CSVs or live API data into clear, actionable visuals within seconds. Beyond simple generation, the smart chat interface allows users to interrogate their data using natural language, asking complex questions to uncover hidden trends, receive intelligent suggestions for optimal visualizations, and instantly refine metrics. This feature democratizes advanced analytics, making deep data exploration accessible to every team member without requiring specialized technical expertise.
Consistent Metric Fabric & Reusable Logic
Fusedash introduces the concept of a "metric fabric"—a centralized layer where all key business definitions, calculations, and dimensions are established. Once a KPI like "North American User Growth" or "Customer Acquisition Cost" is defined, it becomes a reusable, immutable component across the entire platform. This ensures that every chart, dashboard, and report automatically reflects the same calculation, eradicating version conflicts and establishing a single, trusted source of truth that aligns every stakeholder, from leadership to operational teams.
Flexible, Multi-Modal Visualization Engine
The platform provides a revolutionary adaptive canvas that morphs to suit any analytical need. Transform your core dataset into an executive dashboard, a detailed geographical heatmap, a time-series chart for trend analysis, or a narrative-driven report with contextual commentary. This multi-modal capability allows you to build the perfect view for every audience without duplicating underlying data work. Customize layouts, apply dynamic filters, and enable drill-down capabilities to answer not just what happened, but where and why it happened.
SERPView
Unlimited Performance Tracking
Break free from Google's 1,000-row data prison. SERPView provides unrestricted access to over 50,000 rows of granular Search Console data, allowing for deep, comprehensive analysis of clicks, impressions, CTR, and average position across your entire site without any artificial limitations. This foundational feature ensures no critical trend or opportunity remains obscured by data sampling.
Advanced Keyword & Page Intelligence
Move beyond basic metrics to uncover strategic insights. The platform identifies high-intent "money keywords" and provides detailed tracking of position changes over time. Simultaneously, page-level analysis pinpoints your top-performing and under-optimized content, offering a dual lens to refine both keyword targeting and on-page SEO strategies for maximum impact.
Holistic Topic Cluster & Device Analytics
Gain a macroscopic view of your content ecosystem by tracking the performance of entire topic clusters instead of isolated pages. Furthermore, conduct precise mobile versus desktop performance comparisons to identify device-specific optimization opportunities and allocate resources intelligently based on where your audience engages most effectively.
Unified Multi-Property Dashboard
Eliminate the chaos of toggling between accounts. SERPView's centralized command hub allows you to connect and visualize data from all your Google Search Console properties in one intuitive interface. This creates a single source of truth for your entire domain portfolio, dramatically enhancing team coordination and reporting efficiency.
Use Cases
Fusedash
Executive Leadership & Strategic Reporting
Replace static, weekly PDF reports with a living, breathing executive command center. Leadership can access a unified dashboard showcasing top-level KPIs across all departments, with the ability to drill down instantly into specific segments or time periods using intuitive filters and AI chat. Combine high-level metrics with integrated storytelling reports that provide context on performance shifts, enabling faster, more informed strategic decisions based on a consistent data narrative.
Marketing Performance & Campaign Analytics
Marketing teams can consolidate data from multiple channels (social media APIs, ad platforms, CRM) into a single Fusedash workspace. Create real-time dashboards to monitor campaign ROI, generate AI-powered charts to visualize conversion trends by demographic, and build shareable reports that tell the story of a campaign's impact. The consistent metric fabric ensures that terms like "lead" or "conversion" are standardized, providing clear, unambiguous performance analysis.
Operational Monitoring & Real-Time Analytics
Operations and product teams can leverage Fusedash for live monitoring of key systems and user behaviors. Connect live APIs to create real-time interfaces that track application performance, feature adoption, or logistical metrics. Set up intelligent alerts and use the map visualization feature to monitor geographical distribution of events or assets. This enables proactive issue identification and rapid response based on a continuously updated data stream.
Cross-Functional Project & KPI Alignment
Eliminate departmental data silos by creating a shared Fusedash project space for key initiatives. Define project-specific KPIs once in the metric fabric, and allow each team—engineering, sales, support—to build their own tailored views (dashboards, charts) from the same core data. This ensures all teams are aligned on progress, priorities, and outcomes, fostering collaboration and ensuring everyone is working from an identical set of facts.
SERPView
Enterprise SEO Team Collaboration
Large marketing teams can leverage the unified dashboard to break down data silos. By providing a single, real-time view of performance across all properties and regions, SERPView enables seamless collaboration, aligned strategy execution, and streamlined reporting, turning disparate data into a cohesive action plan for the entire organization.
In-Depth Content Strategy Audit
Content managers and SEOs can perform exhaustive audits to revitalize their content library. By analyzing page performance and topic cluster data, they can systematically identify high-potential pages for optimization, discover content gaps, and strategically update or repurpose underperforming assets to drive sustained organic growth.
Precision Keyword Opportunity Mining
SEO specialists can use the advanced keyword analysis to drill deep into the long tail of search queries. By accessing the full dataset, they can uncover untapped commercial keywords, track ranking volatility for core terms, and build a robust, opportunity-focused keyword strategy that directly supports business and conversion goals.
Global SEO Performance Monitoring
For businesses targeting international audiences, SERPView's country and language tracking is indispensable. Marketers can monitor regional performance disparities, identify growth markets, and tailor their technical and content SEO strategies for specific locales, all from a consolidated global performance dashboard.
Overview
About Fusedash
Fusedash is the next-generation AI data visualization platform, engineered to dismantle the traditional barriers between data, insight, and action. It represents a paradigm shift from fragmented, manual reporting to a unified, intelligent workspace. This platform empowers forward-thinking teams to transcend static dashboards, transforming raw, connected data into a dynamic, interactive source of truth. By leveraging cutting-edge AI, Fusedash automates the entire analytical workflow—from intelligent chart generation via natural language prompts to smart metric suggestions and contextual storytelling. It is designed for organizations trapped in endless reporting cycles, where data silos breed conflicting narratives and decision latency. The core revolutionary value lies in its foundational principle of "define once, deploy everywhere." Teams establish their core KPIs and business logic a single time, and Fusedash propagates these consistent, trusted definitions across every dashboard, chart, map, and narrative report. This ensures absolute alignment from the C-suite to frontline operations, turning data into a cohesive, actionable intelligence fabric that drives unified strategy and accelerated outcomes.
About SERPView
SERPView is the next-generation analytics engine, a paradigm-shifting platform engineered to liberate SEO professionals and digital marketers from the restrictive confines of Google Search Console (GSC). It represents a quantum leap in search data intelligence, transforming raw GSC metrics into a dynamic, actionable command center. Designed for the data-driven strategist, SERPView shatters the 1,000-row data barrier, granting unfettered access to over 50,000 rows of granular performance data. This unprecedented depth unveils hidden opportunities, tracks keyword evolution, and illuminates content performance with crystal clarity. Its core value proposition is the seamless unification of multiple GSC properties into a single, collaborative dashboard, enabling teams to transcend manual analysis and achieve hyper-efficient, insight-led decision-making. SERPView is not just a tool; it's the essential operating system for modern SEO, built for those who demand to see beyond the surface and harness the full, untapped potential of their search presence.
Frequently Asked Questions
Fusedash FAQ
How does Fusedash ensure data consistency across different reports?
Fusedash employs a foundational "metric fabric" architecture. When you first connect your data, you define your core business metrics, calculations, and dimensional logic in a centralized, managed layer. Every subsequent dashboard, chart, map, or report built in the platform automatically pulls from these standardized definitions. This means a KI like "Monthly Recurring Revenue" is calculated identically everywhere, guaranteeing that all teams and stakeholders are viewing and acting upon the same verified numbers, eliminating conflicts and confusion.
What types of data sources can I connect to Fusedash?
The platform is built for a hybrid data environment. You can seamlessly upload static CSV files for one-time analyses or historical reporting. For dynamic, live data, Fusedash can connect directly to a wide array of business APIs from tools like Salesforce, Google Analytics, and ad platforms. Furthermore, it allows for the combination of multiple datasets (e.g., merging internal sales data with public demographic data) within a single view, creating rich, contextual insights without requiring external data preparation.
Can non-technical team members use the AI features effectively?
Absolutely. Fusedash is designed with an AI-native interface that prioritizes accessibility. The natural language chat feature allows any user to ask questions like "What were our top-selling products last quarter by region?" in plain English. The AI interprets the query, analyzes the connected data, and can suggest the correct chart type or even generate a complete visualization automatically. This lowers the barrier to entry, empowering business analysts, marketers, and managers to conduct deep data exploration without writing a single line of code or complex query.
How does the storytelling feature differ from a standard dashboard?
While dashboards excel at displaying real-time metrics and KPIs, they often lack narrative context. Fusedash's storytelling feature allows you to embed interactive charts and data tables within a narrative report format. You can add text commentary, annotations, and headers to explain why a metric changed, highlight key takeaways, and propose next steps. This transforms raw data into a persuasive, communicative document perfect for board reports, stakeholder updates, or strategic reviews, ensuring insights lead to clear understanding and action.
SERPView FAQ
How is SERPView different from Google Search Console?
SERPView is a powerful analytics layer built on top of Google Search Console data. While GSC provides the raw data feed, SERPView removes its critical limitations, such as the 1,000-row cap, lack of historical depth, and disjointed multi-property view. It transforms this data with advanced analytics, unified dashboards, and collaborative features GSC does not offer.
What data limits does SERPView have?
SERPView is engineered to overcome data limits. Its primary advantage is providing access to over 50,000 rows of Google Search Console data per report, a 50x increase over GSC's standard interface. This ensures you can perform comprehensive analysis without hitting a sampling wall, seeing a complete picture of your site's search performance.
Can I track multiple websites or properties?
Absolutely. A core function of SERPView is the consolidation of multiple GSC properties. You can connect numerous websites, domain properties, and URL-prefix properties into one centralized dashboard. This eliminates the need to switch between accounts and provides an aggregated, holistic view of your entire search ecosystem.
Is historical data from GSC imported?
Yes, upon connecting your Google Search Console account, SERPView imports and processes your available historical performance data. This allows you to immediately analyze trends over time, track the impact of past changes, and establish performance benchmarks without starting from a blank slate.
Alternatives
Fusedash Alternatives
Fusedash is an AI-native data visualization platform, a leader in the next-generation business intelligence category. It transforms raw data into a unified workspace of interactive dashboards and narrative reports, establishing a single source of truth for entire organizations. Users explore alternatives for various reasons, including specific budget constraints, the need for deeper integrations with a unique tech stack, or requirements for highly specialized analytical functions not covered by a general platform. The search often stems from a need to fine-tune the balance between automated insight generation and granular control. When evaluating other platforms, prioritize solutions that offer true metric consistency, eliminate data silos, and leverage AI not as a gimmick but as a core engine for exploration and narrative. The goal is to transition from static reporting to a dynamic, intelligent data interface that accelerates organizational decision velocity.
SERPView Alternatives
SERPView is a revolutionary analytics platform that redefines the frontier of search data intelligence. It operates within the advanced SEO analytics and data visualization category, transforming the raw potential of Google Search Console into actionable, strategic insights. Users often explore the competitive landscape for various reasons. These can include aligning with specific budget parameters, seeking a particular integration ecosystem, or requiring a unique feature set tailored to a specialized workflow. The quest for the optimal data orchestration tool is a common step in building a high-performance tech stack. When evaluating other solutions, prioritize platforms that offer deep, unfiltered data access beyond standard limits. Look for robust visualization capabilities, collaborative features for team synergy, and a core architecture built for scalability and future-proof insights. The ideal alternative should not just report data, but catalyze strategic decisions.