Fusedash vs Skippership
Side-by-side comparison to help you choose the right AI tool.
Fusedash transforms raw data into instant AI-powered dashboards for real-time team insights.
Last updated: March 4, 2026
Skippership
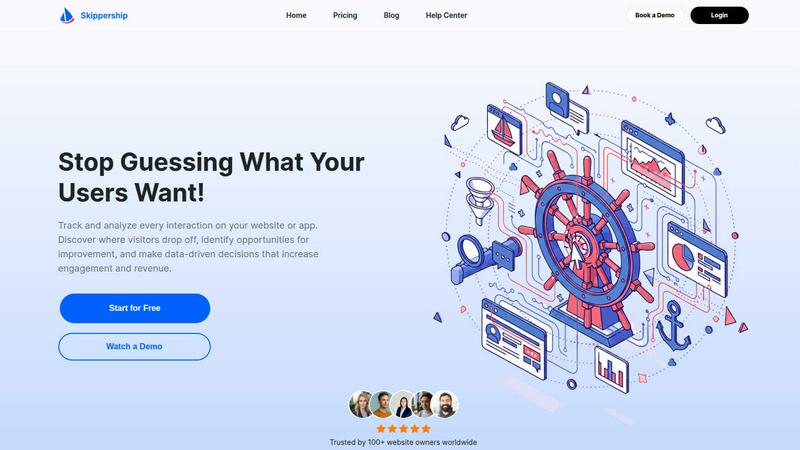
Skippership uses AI to decode user behavior and eliminate friction for data-driven growth.
Last updated: February 28, 2026
Visual Comparison
Fusedash

Skippership
Feature Comparison
Fusedash
Unified Intelligent Workspace
Fusedash consolidates the entire data visualization stack into a single, coherent environment. Gone are the days of juggling separate tools for dashboards, charts, maps, and reports. This singular workspace allows teams to build interactive dashboards for real-time monitoring, craft detailed narrative reports with storytelling sections, and generate standalone AI-powered charts—all from the same connected dataset. This architectural unity eliminates redundant work, ensures metric consistency, and provides a holistic view of performance, enabling a seamless flow from monitoring to deep analysis to communication.
AI-Powered Chart & Insight Generation
Harness the power of integrated artificial intelligence to accelerate data exploration. The platform's AI chart generator transforms raw CSVs or live API data into clear, actionable visuals within seconds. Beyond simple generation, the smart chat interface allows users to interrogate their data using natural language, asking complex questions to uncover hidden trends, receive intelligent suggestions for optimal visualizations, and instantly refine metrics. This feature democratizes advanced analytics, making deep data exploration accessible to every team member without requiring specialized technical expertise.
Consistent Metric Fabric & Reusable Logic
Fusedash introduces the concept of a "metric fabric"—a centralized layer where all key business definitions, calculations, and dimensions are established. Once a KPI like "North American User Growth" or "Customer Acquisition Cost" is defined, it becomes a reusable, immutable component across the entire platform. This ensures that every chart, dashboard, and report automatically reflects the same calculation, eradicating version conflicts and establishing a single, trusted source of truth that aligns every stakeholder, from leadership to operational teams.
Flexible, Multi-Modal Visualization Engine
The platform provides a revolutionary adaptive canvas that morphs to suit any analytical need. Transform your core dataset into an executive dashboard, a detailed geographical heatmap, a time-series chart for trend analysis, or a narrative-driven report with contextual commentary. This multi-modal capability allows you to build the perfect view for every audience without duplicating underlying data work. Customize layouts, apply dynamic filters, and enable drill-down capabilities to answer not just what happened, but where and why it happened.
Skippership
AI-Powered Session Replays
Experience your digital product through your users' eyes with intelligent session replays. Skippership's system doesn't just record; it analyzes. The AI flags critical moments like rage clicks, hesitation, and unexpected navigation, automatically surfacing the sessions that matter most. This transforms hours of review into minutes of actionable insight, allowing you to pinpoint usability issues and conversion blockers with surgical precision.
Dynamic Interactive Heatmaps
Visualize attention and interaction with crystal clarity using dynamic heatmaps. See exactly where users click, scroll, and spend cognitive energy across your pages. This data layer reveals which elements captivate your audience and which are perpetually ignored, enabling you to optimize layout, content placement, and call-to-action positioning for maximum engagement and conversion efficiency.
Predictive Goal & Journey Tracking
Move beyond basic event tracking to predictive journey analysis. Define key conversion goals—signups, purchases, downloads—and let Skippership's AI map the multitude of paths users take to reach (or abandon) them. The system identifies patterns and predicts drop-off points, giving you a prescriptive understanding of what user actions genuinely drive results and where the experience fractures.
Autonomous AI Insight Engine
This is the cognitive core of Skippership. The AI continuously processes vast streams of behavioral data to autonomously uncover patterns, anomalies, and opportunities. It delivers clear, contextual insights—not just raw data—highlighting trends in user behavior, suggesting A/B test hypotheses, and providing actionable recommendations to boost engagement, strengthen retention, and improve overall business outcomes.
Use Cases
Fusedash
Executive Leadership & Strategic Reporting
Replace static, weekly PDF reports with a living, breathing executive command center. Leadership can access a unified dashboard showcasing top-level KPIs across all departments, with the ability to drill down instantly into specific segments or time periods using intuitive filters and AI chat. Combine high-level metrics with integrated storytelling reports that provide context on performance shifts, enabling faster, more informed strategic decisions based on a consistent data narrative.
Marketing Performance & Campaign Analytics
Marketing teams can consolidate data from multiple channels (social media APIs, ad platforms, CRM) into a single Fusedash workspace. Create real-time dashboards to monitor campaign ROI, generate AI-powered charts to visualize conversion trends by demographic, and build shareable reports that tell the story of a campaign's impact. The consistent metric fabric ensures that terms like "lead" or "conversion" are standardized, providing clear, unambiguous performance analysis.
Operational Monitoring & Real-Time Analytics
Operations and product teams can leverage Fusedash for live monitoring of key systems and user behaviors. Connect live APIs to create real-time interfaces that track application performance, feature adoption, or logistical metrics. Set up intelligent alerts and use the map visualization feature to monitor geographical distribution of events or assets. This enables proactive issue identification and rapid response based on a continuously updated data stream.
Cross-Functional Project & KPI Alignment
Eliminate departmental data silos by creating a shared Fusedash project space for key initiatives. Define project-specific KPIs once in the metric fabric, and allow each team—engineering, sales, support—to build their own tailored views (dashboards, charts) from the same core data. This ensures all teams are aligned on progress, priorities, and outcomes, fostering collaboration and ensuring everyone is working from an identical set of facts.
Skippership
Conversion Rate Optimization (CRO) for E-commerce
E-commerce teams deploy Skippership to deconstruct the shopping journey. By analyzing heatmaps on product pages, watching replays of abandoned carts, and tracking the goal funnel from browse to checkout, they identify specific friction points like confusing pricing, broken buttons, or unexpected shipping costs. This enables precise, data-backed optimizations that directly increase average order value and checkout completion rates.
Product Experience & UX Enhancement
Product managers and UX designers use Skippership as their primary research tool. Session replays provide authentic, unmoderated usability testing at scale, revealing how real users interact with new features or navigate complex flows. Heatmaps validate design assumptions about information hierarchy. This continuous feedback loop is essential for iterating on product design to create intuitive, frictionless user experiences.
Digital Marketing Campaign Analysis
Marketing teams leverage Skippership to measure the true impact of campaigns beyond clicks and impressions. By setting goals for lead generation or content engagement and analyzing the user journey from ad click to conversion, they can see which campaigns attract high-quality traffic, which landing pages perform best, and where interested visitors drop off, allowing for real-time campaign and asset optimization.
Identifying and Resolving Technical Bugs
Support and development teams utilize session replays as a powerful diagnostic tool. When users report "something isn't working," teams can instantly replay the exact session to visually confirm bugs, JavaScript errors, or broken flows that traditional error logs might miss. This drastically reduces mean time to resolution (MTTR) by providing engineers with precise, reproducible steps to fix issues.
Overview
About Fusedash
Fusedash is the next-generation AI data visualization platform, engineered to dismantle the traditional barriers between data, insight, and action. It represents a paradigm shift from fragmented, manual reporting to a unified, intelligent workspace. This platform empowers forward-thinking teams to transcend static dashboards, transforming raw, connected data into a dynamic, interactive source of truth. By leveraging cutting-edge AI, Fusedash automates the entire analytical workflow—from intelligent chart generation via natural language prompts to smart metric suggestions and contextual storytelling. It is designed for organizations trapped in endless reporting cycles, where data silos breed conflicting narratives and decision latency. The core revolutionary value lies in its foundational principle of "define once, deploy everywhere." Teams establish their core KPIs and business logic a single time, and Fusedash propagates these consistent, trusted definitions across every dashboard, chart, map, and narrative report. This ensures absolute alignment from the C-suite to frontline operations, turning data into a cohesive, actionable intelligence fabric that drives unified strategy and accelerated outcomes.
About Skippership
Skippership is a paradigm-shifting, AI-native analytics platform engineered to decode the digital genome of user behavior. It represents a quantum leap beyond traditional analytics, moving from passive data collection to proactive, intelligent insight generation. By converging session recordings, interactive heatmaps, goal tracking, and predictive journey analysis into a single, intuitive neural dashboard, Skippership provides a holistic, real-time view of the user experience. Its core, an advanced AI analytics engine, autonomously identifies critical friction points, conversion blockers, and hidden engagement opportunities that human analysts might miss. This empowers digital architects—marketers, product managers, and website owners—to transcend guesswork and make hyper-informed, data-driven decisions. The result is a continuous optimization loop that dramatically enhances user experience, accelerates conversion velocity, and drives sustainable revenue growth, all while maintaining a commitment to zero-complexity usability and robust, privacy-first security standards.
Frequently Asked Questions
Fusedash FAQ
How does Fusedash ensure data consistency across different reports?
Fusedash employs a foundational "metric fabric" architecture. When you first connect your data, you define your core business metrics, calculations, and dimensional logic in a centralized, managed layer. Every subsequent dashboard, chart, map, or report built in the platform automatically pulls from these standardized definitions. This means a KI like "Monthly Recurring Revenue" is calculated identically everywhere, guaranteeing that all teams and stakeholders are viewing and acting upon the same verified numbers, eliminating conflicts and confusion.
What types of data sources can I connect to Fusedash?
The platform is built for a hybrid data environment. You can seamlessly upload static CSV files for one-time analyses or historical reporting. For dynamic, live data, Fusedash can connect directly to a wide array of business APIs from tools like Salesforce, Google Analytics, and ad platforms. Furthermore, it allows for the combination of multiple datasets (e.g., merging internal sales data with public demographic data) within a single view, creating rich, contextual insights without requiring external data preparation.
Can non-technical team members use the AI features effectively?
Absolutely. Fusedash is designed with an AI-native interface that prioritizes accessibility. The natural language chat feature allows any user to ask questions like "What were our top-selling products last quarter by region?" in plain English. The AI interprets the query, analyzes the connected data, and can suggest the correct chart type or even generate a complete visualization automatically. This lowers the barrier to entry, empowering business analysts, marketers, and managers to conduct deep data exploration without writing a single line of code or complex query.
How does the storytelling feature differ from a standard dashboard?
While dashboards excel at displaying real-time metrics and KPIs, they often lack narrative context. Fusedash's storytelling feature allows you to embed interactive charts and data tables within a narrative report format. You can add text commentary, annotations, and headers to explain why a metric changed, highlight key takeaways, and propose next steps. This transforms raw data into a persuasive, communicative document perfect for board reports, stakeholder updates, or strategic reviews, ensuring insights lead to clear understanding and action.
Skippership FAQ
How does Skippership's AI differ from other analytics tools?
Unlike traditional tools that simply aggregate data, Skippership's AI is built for autonomous analysis. It actively learns from user behavior patterns to identify significant events—like rage clicks or conversion bottlenecks—and surfaces them proactively. Instead of you searching through dashboards, the AI delivers curated, contextual insights and actionable recommendations, transforming raw data into a strategic decision-making engine.
Is Skippership compliant with data privacy regulations like GDPR and CCPA?
Absolutely. Privacy and security are foundational to Skippership's architecture. The platform is engineered to align with GDPR, CCPA, and other major privacy frameworks. It employs robust data minimization practices, avoids processing sensitive personal information, secures all data with SSL/TLS encryption, and utilizes compliant cloud infrastructure. You maintain full control over data collection and storage.
What is the performance impact of installing Skippership on my website?
Skippership is engineered for minimal performance footprint. The tracking script is lightweight and asynchronous, meaning it loads without blocking other elements of your site. The platform uses intelligent sampling and efficient data processing to ensure comprehensive insights are gathered without affecting your site's core speed, user experience, or search engine ranking factors.
How quickly can I set up and start gaining insights?
Skippership boasts a true no-code, fast-setup philosophy. You can be up and running in a matter of minutes by simply adding a single snippet of code to your website or app. The intuitive dashboard requires no training, and the AI begins processing and generating insights immediately from the first user session, allowing you to make data-driven decisions from day one.
Alternatives
Fusedash Alternatives
Fusedash is an AI-native data visualization platform, a leader in the next-generation business intelligence category. It transforms raw data into a unified workspace of interactive dashboards and narrative reports, establishing a single source of truth for entire organizations. Users explore alternatives for various reasons, including specific budget constraints, the need for deeper integrations with a unique tech stack, or requirements for highly specialized analytical functions not covered by a general platform. The search often stems from a need to fine-tune the balance between automated insight generation and granular control. When evaluating other platforms, prioritize solutions that offer true metric consistency, eliminate data silos, and leverage AI not as a gimmick but as a core engine for exploration and narrative. The goal is to transition from static reporting to a dynamic, intelligent data interface that accelerates organizational decision velocity.
Skippership Alternatives
Skippership is a revolutionary AI-native analytics platform, operating at the nexus of behavioral intelligence and data-driven optimization. It transcends traditional analytics by deploying advanced AI to decode user journeys, pinpoint friction with surgical precision, and illuminate pathways to enhanced engagement and conversion. Users explore alternatives for various strategic reasons. These can include budget alignment, the need for specific niche functionalities, or integration requirements with an existing tech stack. Some may seek platforms with different scalability models or those offering a more specialized focus within the broader analytics and user experience landscape. When evaluating an alternative, prioritize platforms that offer a cohesive, AI-forward approach. Look for solutions that move beyond mere data collection to provide actionable, predictive insights. Key considerations should include the depth of behavioral analysis, the sophistication of its AI-driven recommendations, and its ability to seamlessly unify quantitative data with qualitative user journey narratives to fuel genuine digital evolution.